Here, in alphabetical order, is a short list of objects. What do they have in common?
ax
baseball bat
baton
bayonet
brick
broken glass
car
chain saw
crossbow
crowbar
flashlight
garden tool
gun
hammer
hand torch
hatchet
knife
machete
meat cleaver
metal pipe
motorcycle
oar
pick-axe
piece of wood
pitchfork
pole
rock
scissors
screwdriver
shovel
spear
sword
Taser
tire iron
According to the Washington Post database, in 2016 there were nine hundred and sixty-three civilians killed by the police, with all but four percent of them being men. That list above enumerates all of the different kinds of weapons that those people were carrying at the time of their death.
Tragically, at the time of their death, some five percent of them were unarmed … but of course in most cases that wasn’t known until after their death.
Equally tragically, at the time of their death, another five percent of them were carrying replica weapons … again not known until after their death. Many of these replicas, sold as toys by the millions, are indistinguishable from the real thing, particularly in the heat of the moment.
Here is a breakdown of the numbers of each type of weapons carried:
 Figure 1. Pie chart of the number and type of weapons possessed by the civilians killed by police in 2016. “Edged/pointed” includes knives, pitchforks, swords, spears, and the like.
I bring this up so that we can all appreciate the context of the interactions that ended in the deaths of these 963 individuals at the hands of the police. By and large, these deaths occurred in the context of an arrest of an armed, violent individual. This means that whenever the police are arresting someone for a violent crime, for pure self-preservation the officers have to assume that the person being arrested is armed.
The inherent violent possibilities of the arrest process also account for most of the fifty-one police officers killed in the line of duty in 2016. However, in addition to those fifty-one officers who died by arrest-related violence, in 2016 there were also a shocking twenty-one police officers killed in deliberate ambushes. This is a worrisome trend. I can certainly understand why cops are on edge and nervous … and edgy, nervous cops are not good for the body politic.
Now with that context of arrests gone bad and split-second decisions made rightly or wrongly, and with compassion for the policewomen and men who have to make those hard decisions, let’s look at what the police are accused of. The most common accusation leveled against the police is that they are killing an unduly high percentage of black people. To investigate this claim, here’s a look at how many people died in 2016 for every 10,000 people of the same race or sex who were arrested for violent crimes in 2016. In addition to the Washington Post data linked to above, I’ve used data from the FBI Crime In The US 2016 report, in particular the arrest data in Table 21A.
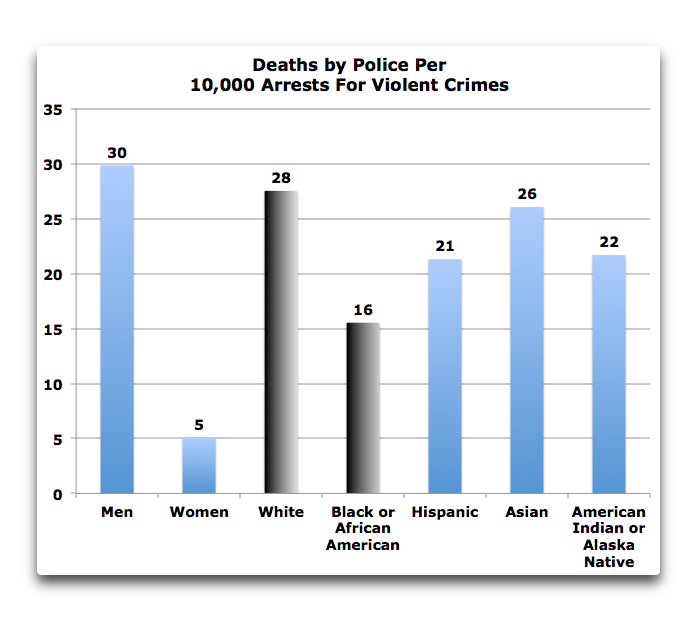 Figure 2. Deaths by race or sex, for every ten thousand arrests of people of that same race or sex for crimes of violence. The FBI definition of crimes of violence is used—murder, robbery, aggravated assault, and rape.
To understand this graphic, let’s start with the left two columns. We see that for every ten thousand men arrested for violent crimes, thirty men died at the hands of the police. And by contrast, for every ten thousand women arrested for violent crimes, only five women died at the hands of the police.
Does this show that the US police are sexists who are prejudiced against men?
Of course not. It means that when cornered by the cops, men are far more likely to indulge in fight/flight than are women … with the predictable results. Men are killed by the cops at a far higher rate than are women.
Moving on to the next two columns depicted in gray, the first one shows that for every ten thousand white people arrested for violent crimes, there were twenty-eight white people killed by police. And for every ten thousand black people arrested for violent crimes, sixteen black people were killed by police.
Now, to me this makes sense. Violent white guys I’ve known tend to think that they are bullet-proof. The evidence says that black guys are more cautious around the cops, and wisely so. And as a result, white guys are killed by cops at a greater rate than black guys.
It also agrees with the analysis I did a year ago of the 2015 data, which I detailed in a post called When Arrests Go Bad. Just as had occurred in 2015, once again in 2016 white men were killed at a higher rate by the police than were black men. This indicates that it was not a mere anomaly.
Next, I want to be clear what this analysis does and does not mean. In short, it means what it says and nothing else. As one example among many, it doesn’t address the issue of people of color getting stopped for “DWB”, Driving While Black.
Is there still racial animus and hatred in the US? Of course. Until I was 19, it was illegal in several US states for white and black people to marry. Isn’t that bizarre? Illegal. That kind of fear and bitterness doesn’t disappear in one lifetime. This analysis doesn’t change that.
Nor does this mean that the cops are either saints or sinners. Cops are not the other—they are us, with all of our faults and virtues. Some cops are assuredly racist thugs … just like us. But for the most part, again like us, they are just fools whose intentions are good. They are called on to make life-and-death decisions literally in split seconds.
And yes, just like us, sometimes the police get it wrong. But to their credit, there is no evidence that police are targeting black people for death. Quite the opposite. The data clearly shows that black people are being killed by police at a lower rate than are white people.
Now, I know that this doesn’t fit the current narrative, which claims that there are heaps of racist cops out there murdering black men at a rate of knots … I can only tell you what the facts are, and the facts absolutely falsify that narrative.
Finally, let me say that any death at the hands of the police is a tragedy for everyone involved, including the police officer. In my previous post linked above I discussed some of the ways that the police might reduce that number of deaths.
But the police can’t do it all, or even most of it. The number one way to reduce police shootings, of course, is for everyone to do what my mom told me, to do what every responsible mom tells every son—“If you are stopped by the police, be polite, do what they tell you, keep your hands in view, and don’t resist arrest”.
Simple advice, but if everyone took it the number of people killed by cops would go way, way down.
=====================
Here, we have late summer sunshine this afternoon, now that the morning ocean fog has burnt off. The cat is discussing matters of mortality with the local insect population, he loves chasing and eating bugs. I’ve often wondered just how much protein he gets from the exercise. What a world, where life eats life to live …
Best of this lovely life to all,
w.


it’s good to see analysis like this
LikeLike
Wilis to complete this story it would be good to see the inverse statistic – Of the 51 police officers how many were killed by men, women, white, black etc. I know that n is small for this data set in a single year but it would be informative.
LikeLike
Had dinner with a liberal couple. Told them that blacks kill at 8.5 times rate for whites. Not interested. Cops are killing blacks; that’s all they know, and all they want to know.
LikeLike
That’s all they’ll ever know. They don’t get confused by mere facts.
LikeLiked by 1 person
Thanks for your usual lucid, to-the-point analysis. So sad the MSM and others are not willing to co front the truth and tell people with sympathies like themselves that they are wrong in their beliefs.
As you say, racism still exists in the US, but it in no way is that racism determinative in outcomes for racial minorities. It would be such a breath of fresh air if African-American leaders were to say “We control our own destiny; we cannot accept lawlessness among our people; we must have strong families and value education and hard work. We WILL overcome!”
LikeLike
Hi Willis, always interesting reading your posts. One thing, I don’t think that “The evidence says that black guys are more cautious around the cops” is necessarily the obvious conclusion from the evidence, I posit that it is more that with the social climate being what it is for the past decade or so cops are extra extra extra cautious when confronting black people/criminals as the cops will be under much greater scrutiny and likely face protests etc… which win or lose the cops will have their lives ruined as we have seen in many of the high profile cases in recent memory.
Cheers!
Joe
LikeLike
Thanks, Joe. Likely it is some combination of the two, caution on both sides. And my heart goes out to all cops who end up shooting somebody … I can’t imagine how that would affect me, but it would not be pretty.
w.
LikeLike
Well here’s a clue: https://www.youtube.com/watch?v=uj0mtxXEGE8
LikeLike
Reblogged this on gottadobetterthanthis and commented:
~
Perspective
LikeLike
What were the races of the 48 unarmed? There was another study the made a big deal out of the race of the unarmed.
LikeLike
Don E November 3, 2017 at 10:34 am
I saw that study. They made the usual mistake of taking the rate of deaths per population rather than the rate of deaths per arrest for a violent crime. They also didn’t calculate the uncertainty of their results, which is large because there are only 48 items in the sample.
Here are the facts. 41% of all arrests for violent crimes were of white people, and 44% ± 7% of the unarmed deaths were of white people. What you’d expect.
On the other hand, 37% of all arrests for violent crimes were of black people, and 35% ± 7% of the unarmed deaths were of black people. Again, what you’d expect. And since the uncertainties overlap, we cannot even say that unarmed white deaths are different than unarmed black deaths.
In other words … no prejudice either way, results what we’d expect, and well within errors.
w.
LikeLike
” I’ve often wondered just how much protein he gets from the exercise.”
I’ve watched barn swallows patrol the right-of-way behind my house, lots of flying (just above the deck) with the occasional quick maneuver that I assume means a bug has just been inhaled, eaten out of mid-air, no feet needed, they just open their mouth I guess.
Anyway, I said to my sister that they sure seem to be expending a lot of energy, but apparently whatever they are catching is enough.
LikeLike
What are the comparative rates of beng stopped for violent crimes by these demographic categories? How is the cause of a stop determined?
LikeLike
Good question, Joshua, but I don’t think the data exists to answer that.
However, it doesn’t matter for my analysis. It may be that people of color are arrested more often than white people, but the cause for the arrest and its justice or justification don’t matter for this analysis. All that matters for this analysis are the total numbers of arrests, because the odds of an arrest going bad and ending in death depend on the numbers of arrests.
Yours is an interesting point, and one I’ve thought about, but like I say, I don’t think the data exists out here. There was a study a while back of a single city (Houston?) that looked at your question, but nothing national.
w.
LikeLike
What is the difference between being stopped for a violent crime and being arrested? If the question is being stopped for suspicion of any crime, like stop and frisk, then I believed Blacks are stopped more.
According to Roland G. Fryer “On non-lethal uses of force, blacks and Hispanics are more than fifty percent more likely to experience some form of force in interactions with police.” On the other hand, he says: “On the most extreme use of force officer-involved shootings we find no racial differences in either the raw data or when contextual factors are taken into account.”
LikeLike
In terms of ‘stop and frisk’ type of things, make sure you correlate it with the crime rate in the area.
It makes sense that there are more stops in high crime areas.
It’s an unfortunate fact that Blacks are more likely to live in high crime areas than Whites.
Thus it makes sense that a higher percentage of Blacks will be stopped in those high crime areas than Whites in lower crime areas
David Lang
LikeLike
The issue was racial differences in shooting not whether more Blacks are stopped. There may be more stops in high crime areas, but the referenced study on use of force found a racial difference in the use of force in both low and high crime areas. However, there was no racial difference in shootings.
“An Empirical Analysis of Racial Differences in Police Use of Force” Roland G. Fryer, Draft: July 2016
LikeLike
Thanks, Don. Do you have a link for the Fryer quote? I ask because the quote is not clear about how he’s come to the conclusions … he doesn’t say what the comparison is to in the quote. Raw population? Numbers arrested?
The same is true of your statement that “blacks are stopped more” … stopped more compared to what? To population? To numbers of arrests?
The problem with all of these numbers is that black people, for a variety of reasons, commit far more crimes per capita than any other group … and when a group is committing more crimes per capita, they will undoubtedly be stopped, questioned, and arrested more often per capita. In 2016 or example, for every one million population, black people murdered 75 people, while white people murdered 14 people per million of the white population …
And when you have that kind of discrepancy in offenses, it will reflect itself in all the other statistics related to offenses—stops, frisks, and arrests. When you murder people at a rate five times the rate that your neighbors murder people, that’s what happens …
w.
LikeLike
The fryer study did not say Blacks are stopped more. I did, based on what I recall other studies saying. The issue was not being stopped more, but the use of force.
In terms of stopping to frisk, obviously, cops play the odds. They would most likely not stop a Chinese grandmother to frisk. One does not go to the refrigerator to find clean underwear.
LikeLike
Some good analysis and discussion here, but before diving into the percentages I’m struck by the total number of people actually killed by police in US – nearly 1000 in one year! I know this is a complex question, but surely there should be some thinking about how to get this number down.
As a comparison, in the same year the total number of people killed by police in UK (with roughly 20% population of US) was four. I can’t find 2016 numbers for Germany (with an armed police and larger population than UK) but in 2015 it was ten.
LikeLike
The first step should be to look at the data by state. State’s with low numbers may suggest how to get the numbers down.
LikeLike
Don E November 17, 2017 at 9:15 am
Thanks, Don. Been there … done that …
As you can see, there is no correlation between murder rates and gun ownership rates. Oh, and the one there all alone at the top?
That’s the District of Columbia, also known as Washington, D.C. … thus proving that if you hang around politicians long enough, you’ll end up wanting to kill somebody …
w.
LikeLike
That suggests gun ownership is not the cause of homicides. The question was the number killed by police in the US; how to get that number down.
LikeLike
What about this study?
https://www.ncbi.nlm.nih.gov/pmc/articles/PMC3828709/
LikeLike
Don E November 19, 2017 at 9:35 am
It’s interesting, but I fear that the authors have overestimated the significance of their results. Take, for example, this description of what they have done:
The first problem is that all of those things that they claim that they are “controlling” for each have associated errors … so they are combining the unknown errors of 19 different measures. Not a good thing, and not a good practice either. See Occam and his Razor.
The next problem is that their claim is that gun ownership is only one of twenty different measures, each of which significantly affects the firearms homicide rate. Their claim means, of course, that the effect of any given one of them is likely to be small.
The next problem is that they are NOT actually investigating the gun homicide rate. Why? Because, as they point out, they don’t have the necessary data for all of the states for the entire time period of the study. So instead, what they are studying is the gun suicide rate, and NOT the gun homicide rate. They point out that the two measures are correlated … so what?
Let me give an example why this is important. The gun suicide and homicide rates of black people are markedly different from those of white people. From the Brookings Institute
They say they are “controlling” for race … but since they are using suicide rates, that will NOT control with respect to homicide rates, since the two races differ by so much regarding gun homicide and suicide.
So I fear that the authors of the study are a ways from establishing their claims.
w.
“If your experiment needs statistics, you ought to have done a better experiment.” – Ernest Rutherford
LikeLike
Don, there’s another difficulty with the study. They are trying to see if gun ownership rate correlates with gun murder rates. So they “control” for nineteen! other variables which they have determined also affect gun murder rates.
The problem is that, at least as far as I can see, they have not considered that in addition to affecting gun murder rates, various of these factors also likely affect gun ownership rates. This can bias the analysis in unpredictable ways.
In addition, the combination of two, three, or more of these factors may also have unexpected effects. There are 171 distinct combinations of two factors, 969 combinations of three factors … I’m sure you can see the problem.
w.
LikeLike
Thanks for the analysis. I suppose this is an example of torturing the data until it confesses. I think they also calculated the gun ownership rate based on the number of suicides.
I recall an exercise in partial correlation over 50 years ago, eliminating the correlation between the number of liquor stores and churches in the 100 largest cities by factoring in population. Back then the calculations were done on mechanical calculators supplemented with a slide rule. It took hours. Today one can play with various variables until one gets the right answer.
LikeLike
Thanks, Don E, for the link to the study. I skimmed through it. My first impression of it was it has a shotgun approach. Willis has valid points. Here are a couple more.
Table 4 shows they tried using a survey to measure gun ownership instead — and the statistical significance disappeared.
“Survey measure of gun ownership used instead of proxy measure (years 2001, 2002, and 2004 only)”
“Main predictor variable was proportion of households with guns according to BRFSS in 2001, 2002, and 2004; proxy measure (firearm suicides divided by all suicides) was not used in this model.”
Table 3 shows the effect of six variables on the homicide rate in their model (six were significant). For a change of the variable by one standard deviation, the “firearm homicide rate increased by [about] 10.0%” I’ve quoted one of them, five of the six are in the range 8% to 15%. But there is one which is outstanding:
“Percentage Black 1.828 (1.536, 2.176) .001 For each 1-SD increase in proportion of black population, firearm homicide rate increased by 82.8%”
They don’t comment on that.
Their model, when stripped down to the very core, is that guns kill people: if there are more guns there are more gun murders. Too bad they don’t have better gun ownership stats. I would like to see how many murders are broken down by type: hunting rifles, shotguns, hand guns, assault rifles, automatics, silencers, caliber. Imagine a study of stabbing murders using percentages of households which own knives (including butter knives) as the main predictor.
It’s hard to disagree with the second half of the famous slogan “people kill people”. I would like to see the study on that. Why are some people or some cultures more murderous?
LikeLike
Willis
You have dived into a totally different question. I was not looking at the overall murder rate or anything to do with gun ownership. I was asking about the 1000 people per year *killed by the police*. Is that number is too high and what if anything should be done about it? In this case the bigger picture is at least as interesting as the detail.
LikeLike
AndyL November 21, 2017 at 11:14 pm
Upon review, true you are … the problem with what you were actually asking for is the uncertainty. Killings by police are so rare that there is large uncertainty in the results. Anyway, here they are:
As you can see, other than the first few the uncertainty of the result means that we often can’t tell if the results are likely to be different than zero.
w.
LikeLike
Interesting graph. I only see about half the states though. Are the rest down in the bottom with the low numbers? For example, high population states like California and New York? Some of the states at the top of the list are rather small, so we might expect very small numbers of people killed by their police and fewer arrests, and that would make the ratios (of small numbers) have high uncertainty too. Those error bars in the table seem too narrow.
Or, it could be that those states do have some problem which makes arrests more risky. In Figure 2 above, the average is 3.5 deaths per 1000 arrests. Only the first 10 states in this list have their lower error bar value higher than that, making them the “bad-apple states”?
For comparison, the FBI table 24 has data on the number of police by region and city size. For the whole US, the average number of officers per 1,000 inhabitants is 2.2 (varies from 1.1 to 4.1). Does having more police per capita imply that there is more crime? The 10 bad-apple states in this graph are from regions with both high and low police per capita. Or, maybe it’s not bad-apple states, but bad-apple regions. Or maybe it’s just bad-apple criminals who pop up randomly all over. Beats me.
The neighbors of the bad-apple states should be somewhat similar, but those states are not near each other in this list. What makes those ten different? — if they really are different.
It’s easier to speculate on an answer to this question. Perhaps some countries respect their police, appreciate the work they do, don’t call them pigs, and don’t advocate murdering them. Just a guess.
If the police feel threatened, it’s expected that they would have their finger closer to the trigger. Others will claim the US is a gun culture and their own police are better trained. Maybe, but as I have said before, it’s not the gun ownership culture, it’s the gun use culture.
I wonder how the ratio of the number of police killed by civilians over the number civilians killed by police varies by region and by country.
Here are some related links:
http://www.americanthinker.com/blog/2017/11/chicago_baltimore_how_about_rio.html
https://en.wikipedia.org/wiki/Police_firearm_use_by_country
https://en.wikipedia.org/wiki/List_of_killings_by_law_enforcement_officers_by_countries
I found one claim for the UK: “In this century, 25 U.K. officers died in the line of duty. The figure for the U.S.—2,445—is nearly 100 times that. Adjusting for numbers of officers, U.S. deaths are still 10 times higher.”
And for Germany: “Unlike the US, where almost as many weapons are in circulation as the country has citizens, German police officers are rarely confronted by armed people.”
LikeLike
Thanks, YMMV. You are correct that those are the high-incidence states, and the rest are all down at the bottom.
I was surprised at the number of New England states in the high zone.
As to the error bars, I figured them in the normal way, as being sqrt( p (1 – p ) / n), where p is the probability of occurrence and n is the number of people arrested.
Finally, of course, there are huge differences. I can understand the situation in Alaska, for example—there’s a reasonable number of folks with guns there who are, if not un-hinged, are at least loosely hinged … but Maine?
w.
LikeLike
“As to the error bars, I figured them in the normal way”
In-joke: for big enough n everything is normal.
Fortunately, police shootings are rare, and for small quiet states, the number of them is very small.
If that is the case (I’m not sure what n is for Vermont for example, the list I saw was by city not by state), I would suggest using the Poisson distribution instead. For those who are not familiar with that, this page is good and I’m sure there are many others:
https://en.wikipedia.org/wiki/Poisson_distribution
Ignore the rate at first and just look at the numbers. For a Poisson distribution, the mean is the same as the variance. We don’t know what the true distribution mean is but we can estimate it from our (one!) sample (the value of n). The confidence intervals for the Poisson are more complicated.
If we had more samples, it would get more interesting:
Click to access EstimatePoissonPopulation.pdf
(just for entertainment)
Anyway, for the small states, that might make a difference.
I understand the New England states have a drug problem. When I drive through some rural areas of those states I have to think that the slogan “Make America Great Again” is genius. Beautiful places which have gone to pot. The Democrats should be kicking themselves that they didn’t think of that slogan first.
Yeah, you’re right about Poisson, but I was moving fast. The difference isn’t that great, basically it just keeps things from going below zero.
As to the slogan “MAGA”, Trump actually trademarked that before he announced as a candidate …
w.
LikeLike
These two web pages are from 2015 so the data isn’t up to date. What they show is that the police in Vermont and other small states don’t kill very many people. It says nothing about the number of arrests or the population size, so this is just another piece to the puzzle.
https://mic.com/articles/122161/one-map-shows-all-the-people-police-have-killed-in-each-state-so-far-this-year
https://splinternews.com/the-one-state-where-police-havent-killed-anyone-in-2015-1793851523
LikeLike
Is any of that State level data on killings by police comparable to Great Britain and Germany?
LikeLike
Pingback: Watching Violence In Black And White | Skating Under The Ice
Pingback: Black Lies Matter | Skating Under The Ice